Imager characterization includes the following parameters:
- Electrons per digital number (DN).
- Poisson noise is the noise due to variation in the number of photons falling on a pixel. It is the square root of the average number of photons.
- Dark offset is the offset in electrons applied to prevent negative values at the imager analog to digital converter.
- Quantum efficiency (QE), is the ratio of the number of electrons produced divided by the number of photons falling on the pixel, it varies with wavelength.
- Read noise, this is the standard deviation in electrons due to reading a pixel.
- Dark signal non-uniformity (DSNU), this is the standard deviation of the dark signal in electrons.
- Pixel response non-uniformity (PRNU), is the standard deviation of the pixel values, corrected for DSNU, divided by the average level.
- DSNU and PRNU lead to fixed pattern noise, DSNU can be isolated by averaging dark frames and PRNU can be isolated by averaging bright frames.
These parameters are all required to simulate an image. Quantum efficiency is determined by illuminating the imager with a narrow band source calibrated in photons per area. The QE at a given wavelength is the number of electrons generated at a pixel divided by the number of photons falling on the pixel. In order to determine the number of electrons, the number of electrons per digital number has to be determined.
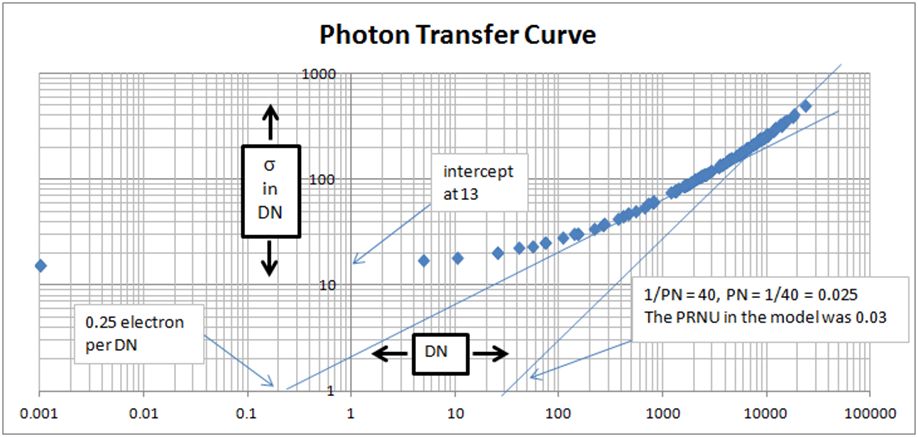
A technique called photon transfer can be used to determine the number of electrons per digital number as well as a number of other parameters. This technique has been refined by James Janesick and Tom Elliott over the last thirty years. The book Photon Transfer by James Janesick is the result of this experience. The photon transfer technique starts with a number of image samples at different levels and the corresponding standard deviations. Commonly the samples are patches on one image or separate exposures of the whole imager at different levels. The exact levels are not important as long at there is a range of levels. The average level of each patch in digital numbers is plotted against the standard deviation of the patch in digital numbers on a log-log graph. An example is shown below.

If Excel is used to create the log-log graph the margins have to be adjusted so each decade is square because many of the parameters are determined based on the slope of the line. There are two straight line slopes to the curve. The first straight line should have a slope of one half because the Poisson noise has a square root relationship to signal level. The intercept of this line with the y=1 axis is the number of electrons per digital number. Many of the remaining parameters depend on this number. The intercept at the x=1 line is the read noise in digital numbers. The read noise in electrons is determined using the number of electrons per digital number. The second line has a slope of one because PRNU noise is proportional to the signal value. This line crosses the y=1 axis at the inverse of the PRNU. PRNU is a ratio so it doesn't have to be converted to electrons.